What if I told you that every improved cookstove and safe water system in the world reduces emissions using the exact same mathematical DNA?
After 9 weeks of building intuition—from understanding your kitchen as a micro power plant to wrestling with fNRB controversies—we’ve finally arrived at the moment where all those concepts crystallize into actual carbon credits.
This is where the concepts converge into numbers. Where thermal efficiency percentages, baseline surveys, and suppressed demand assumptions stop being abstract ideas and start generating tradeable tonnes of CO₂ equivalent.
Today, we’re decoding the Emission Reduction (ERy) formula—the elegant equation that transforms field data into verified carbon credits.
The Journey So Far: A Quick Recap
Phase 1: Foundations & Intuition (Weeks 1-5)
We built the conceptual scaffolding:
Phase 2: Core Concepts (Weeks 6-10)
We dove into the measurable mechanics:
Why This Formula Matters
Before we dive in, understand this: carbon methodologies are essentially sophisticated accounting frameworks.
They try to model the significant aspects of the cooking and its consequences into simple, mathematical formula. This ensures standardisation of emission reduction calculations.
They don’t “create” emissions reductions—your improved stove or water filter does that in the physical world.
What the formula does is:
The ERy formula is where policy meets physics.
The Universal Structure: Breaking Down ERy
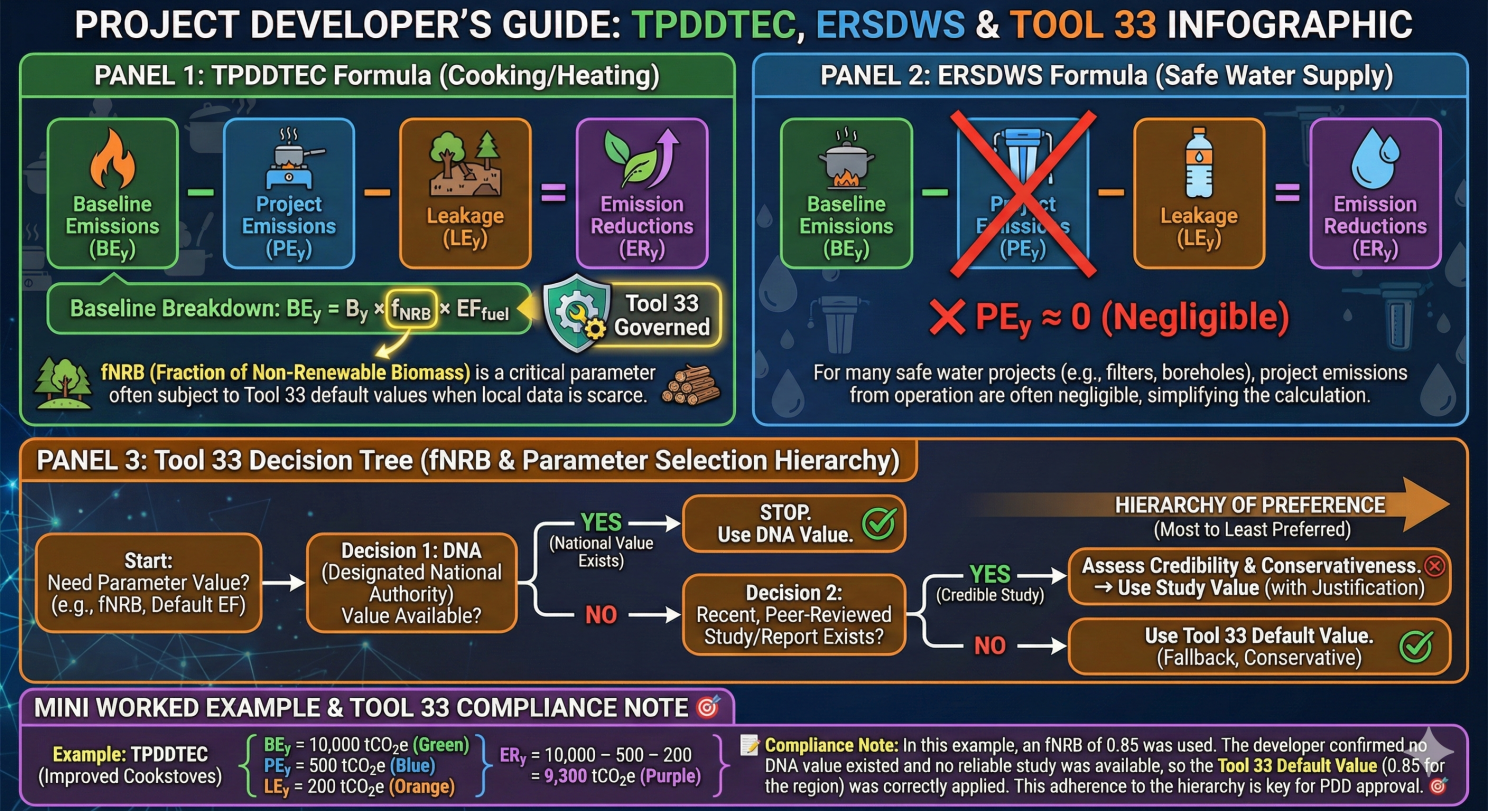
Both TPDDTEC (cookstoves) and ERSDWS (safe water) follow the same fundamental logic:
The Core Formula Architecture
ERy = (Baseline Emissions) − (Project Emissions) − (Leakage)
TPDDTEC: The Cookstove Carbon Equation
Let me walk you through this step-by-step, building from the ground up.
Step 1: Understanding the Baseline Emissions
What we’re asking: How much CO₂ would these households have emitted if we never showed up with improved stoves?
The formula component:
BEy = Σ(Bi,y × fNRB,i,y × NCVB,i,y × EFCO₂,i,y × ny)
Let’s decode each variable like we’re explaining it to the village implementation team:
Bi,y = Baseline fuel consumption per household per year
Think: "How many kg of firewood did families burn annually in their traditional 3-stone fires?" Data source: Kitchen Performance Tests (KPT) from representative householdsfNRB,i,y = Fraction of non-renewable biomass
Think: "What percentage of that firewood came from forests that aren't regrowing?" Data source: CDM Tool 33 (more on this critical governance piece below). Impact: This is your multiplier—the higher the fNRB, the greater the carbon caseNCVB,i,y = Net calorific value of biomass
Think: "How much energy is stored in that firewood?" Data source: Standard tables (~15.6 MJ/kg for wood) or lab testsEFCO₂,i,y = Emission factor
Think: "How much CO₂ is released per unit of energy when we burn it?" Data source: IPCC default values or regional datany = Number of devices (households) in year y
The Σ symbol known as capital sigma means we sum across all baseline stove types (i) because some households might have been using different baseline scenarios.
Step 2: Calculating Project Emissions
What we’re asking: How much CO₂ are these households NOW emitting with improved stoves?
The formula component:
PEy = Σ(Pi,y × fNRB,i,y × NCVB,i,y × EFCO₂,i,y × ny)
Notice the structure is IDENTICAL to baseline—we’re just swapping in new fuel consumption data:
Pi,y = Project fuel consumption per household per year
Think: "How much firewood do they burn NOW with the improved stove?" Data source: Post-distribution KPTs showing actual usage Key insight: This should be LOWER than Bi,y due to improved thermal efficiencyHere’s where it gets interesting: Some projects completely eliminate biomass by switching to LPG or electricity.
In those cases, Pi,y might be zero for biomass, but you'd track new fuel types separately with their own emission factors.The Three Methods: Flexibility Within Rigor

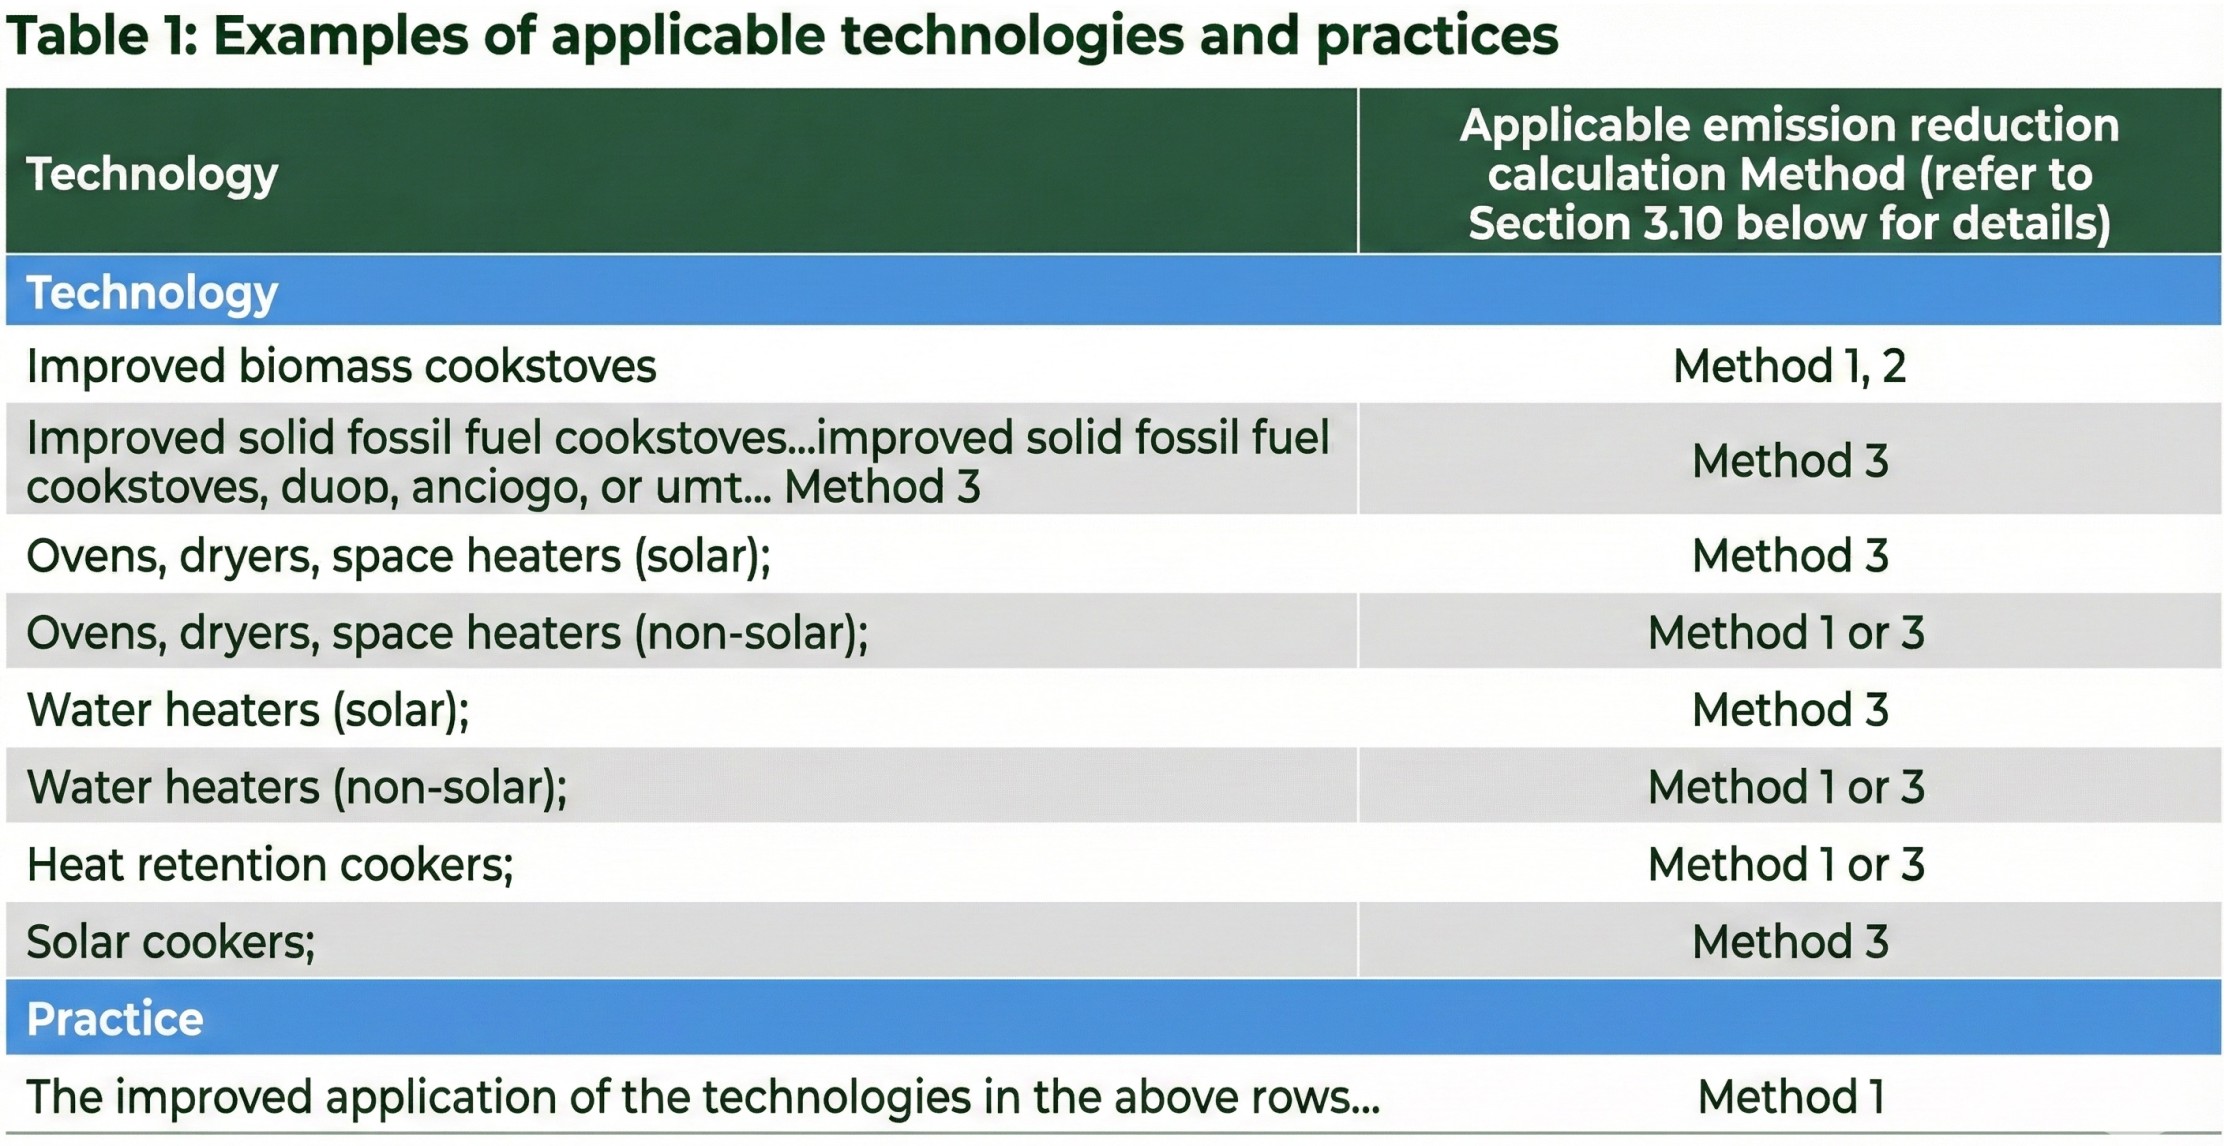
Here’s where TPDDTEC shows its sophistication. The methodology recognizes that not all cookstove interventions work the same way, so it offers three calculation methods based on your project type:
Method 1: Efficiency-Based Approach
Method 2: Default Specific Fuel Consumption (SFC)
Method 3: Fuel Switch Approach
Where Pi,fossil = new fuel consumption and EFfossil = emission factor for that fuel
Audit trap: Proving households actually switched and didn't just add LPG on top of biomass (stove stacking)Why Three Methods Matter:
This isn’t just bureaucratic complexity—it’s methodological elegance. By offering three pathways, TPDDTEC enables:
Method Selection is Strategic:
The method you choose gets locked into your Project Design Document (PDD) and must be justified with evidence. Auditors will verify you picked the method that matches your actual intervention logic.
Step 3: Accounting for Leakage
What we’re asking: Did our project inadvertently cause emissions elsewhere?
LEy = Leakage emissions from project activities
Common leakage sources:
Conservative approach: Most methodologies require you to deduct potential leakage even if actual monitoring shows minimal impact.
The Final TPDDTEC Equation:
ERy = BEy − PEy − LEy
Or, expanded:
ERy = Σ[(Bi,y − Pi,y) × fNRB,i,y × NCVB,i,y × EFCO₂,i,y × ny] − LEy
What this tells you: The annual emission reductions (in tonnes CO₂e) that your improved cookstove program achieved.
ERSDWS: The Safe Water Carbon Equation
Now let’s see how the same logic applies to safe drinking water projects.
The Baseline Question for Water
If we hadn’t provided this water filter/chlorination system/borehole, what would households have done?
For unsafe water sources, the assumption is: they would have boiled water using biomass fuel.
The baseline emissions formula:
BEy = Qpop,y × DO × Mq,y × 365 × fNRB,y × NCVB,y × EFCO₂,y / ηboiling
Let’s unpack this with the same care:
Qpop,y = Total population served by the project in year y
Think: "How many people now have access to safe water?"DO = Daily per capita water consumption requiring treatment (liters)
Think: "How much drinking water does one person need per day?" Typical value: 2-5 liters/person/dayMq,y = Fraction of DO that would have required boiling
Think: "What percentage of their drinking water would they have boiled in baseline?" Data source: Household surveys asking about baseline water treatment practices. Conservative note: This applies suppressed demand logic365 = Days per year (converting daily to annual)
fNRB,y = Fraction of non-renewable biomass (same governance as cookstoves—Tool 33 applies)
NCVB,y = Net calorific value of biomass used for boiling
EFCO₂,y = Emission factor for biomass combustion
ηboiling = Thermal efficiency of boiling device
Think: "How efficient was their traditional pot + fire setup at heating water?" Typical value: 10-15% (very inefficient!) Impact: Lower efficiency = higher baseline emissions = larger carbon caseProject Emissions for Safe Water
Here’s the elegant part: Project emissions are typically ZERO for:
Why? Because these technologies don’t burn anything. The water is made safe through:
So the project emissions term drops out:
PEy = 0
ERSDWS Leakage
Potential sources:
These are usually small compared to avoided boiling emissions.
The Final ERSDWS Equation:
ERy = BEy − PEy − LEy
Since PEy ≈ 0 for most safe water projects:
ERy = [Qpop,y × DO × Mq,y × 365 × fNRB,y × NCVB,y × EFCO₂,y / ηboiling] − LEy
What this tells you: The annual tonnes of CO₂e avoided by preventing water boiling through safe water access.
The Parameters That Move the Needle
After working through both formulas, three parameters emerge as the “high-leverage” variables that dominate your carbon case:
1. fNRB — The Carbon Multiplier (Now Under Strict Governance) 🌳
The Evolution of fNRB Governance:
Here’s where the rubber REALLY meets the road—and where Gold Standard for the Global Goals (GS4GG) has transformed the game.
What Changed: GS4GG’s adoption of CDM Tool 33 means project developers can NO LONGER arbitrarily choose fNRB values. This is a watershed moment for carbon market integrity.
How Tool 33 Works:
Tool 33 establishes a decision tree hierarchy that removes subjectivity:
Step 1: Check for Official National Values
Step 2: Use the Most Recent Peer-Reviewed Study (if no DNA value exists)
Step 3: Conduct Project-Specific Surveys (only under specific conditions)
Why This Framework Matters:
Before Tool 33 adoption:
After Tool 33 adoption:
Real-World Impact:
Let me show you how this changes project economics:
Scenario A: Pre-Tool 33 (arbitrary selection)
Scenario B: Post-Tool 33 (governed selection)
Result: 9% reduction in credit volume, but 100% increase in verification confidence
The Trade-Off: Projects may generate fewer credits, but those credits have:
Practical Implications for Project Developers:
Due Diligence Phase: Before project design, research:
Financial Modeling:
PDD Development:
Monitoring Reports:
The Bigger Picture:
Tool 33 is part of GS4GG’s broader push toward evidence-based carbon accounting. It signals:
Bottom Line: fNRB remains the highest-leverage multiplier in the ERy formula, but you can no longer optimize it. Tool 33 turned fNRB from a strategic choice into a compliance requirement.
2. Baseline Fuel Consumption (Bi,y for stoves / boiling parameters for water) 🔥
3. Efficiency Improvement (captured in Bi,y − Pi,y ratio) ⚙️
Worked Example: Seeing It Come to Life
Let’s calculate ERy for a small improved cookstove project under Tool 33 governance:
Project Details:
Due Diligence: Determining fNRB per Tool 33
Step 1: Check Kenya DNA official values
Baseline Scenario (traditional 3-stone fire):
Project Scenario (improved stove):
Other Parameters:
Calculation:
1. Fuel saved per household:
Bi,y − Pi,y = 2,190 − 1,314 = 876 kg/year
2. Convert to energy:
876 kg × 15.6 MJ/kg = 13,666 MJ/year
3. Convert to CO₂:
13,666 MJ × 112 g CO₂/MJ = 1,531 kg CO₂/year
4. Apply fNRB (Tool 33 value):
1,531 kg × 0.89 = 1,363 kg CO₂e per household
5. Scale to full project:
1.363 kg × 1,000 households = 1,363 tonnes CO₂e
6. Subtract leakage:
ERy = 1,363 − 50 = 1,313 tonnes CO₂e/year
Result:
This project generates approximately 1,313 carbon credits per year.
At current voluntary carbon market prices (~$10-30/tonne), that’s $13,130 – $39,390 in annual carbon revenue.
Comparison Note:
If the developer had claimed fNRB = 0.98 (pre-Tool 33 era), the same project would have generated 1,450 credits/year—a difference of 137 credits.
But the Tool 33-compliant credits will:
The Formula’s Hidden Wisdom
Now that you’ve seen the math, notice what the formula is really doing:
1. It Forces Honesty
Every variable must be measured, estimated conservatively, or justified with data. You can’t hand-wave your way through an audit. Tool 33 for fNRB is Exhibit A of this principle.
2. It Rewards Real-World Performance
The (Bi,y − Pi,y) difference means you only get credits for ACTUAL fuel displacement, not theoretical lab performance.
3. It Builds in Conservativeness
4. It’s Globally Comparable
A cookstove project in Kenya uses the same formula structure as one in Honduras.
This enables:
Common Pitfalls (That Will Show Up in Audits)
After walking through the formula, here are the mistakes I see most often:
❌ Pitfall 1: fNRB Non-Compliance with Tool 33
The mistake: Using an outdated fNRB value or claiming “project-specific” values without following Tool 33 hierarchy.
Why it happens: Developers are unaware of Tool 33 requirements or designed their PDD before GS4GG adoption.
How auditors catch it: First thing verifiers check—”Show me your Tool 33 decision tree documentation.”
Fix:
❌ Pitfall 2: Baseline Inflation
The mistake: Claiming unrealistically high baseline fuel consumption to inflate emission reductions.
Why it happens: More baseline = more credits = more revenue.
How auditors catch it: They compare your baseline values against:
Fix: Use conservative, well-documented baseline surveys with proper sampling methodology (remember Week 5's 90/10 confidence approach).❌ Pitfall 3: Ignoring Usage Rate Decline
The mistake: Assuming 100% of distributed stoves remain in active use forever.
Why it happens: Tracking attrition is hard and reduces credit volumes.
How auditors catch it: Follow-up monitoring surveys that check actual usage, not just distribution records.
Fix: Apply conservative usage rate factors (e.g., 80% in Year 1, declining 5%/year) based on monitoring data or methodology defaults.❌ Pitfall 4: Overlooking Leakage
The mistake: Setting LEy = 0 without proper analysis.
Why it happens: It’s tedious to quantify manufacturing emissions or LPG supply chain impacts.
How auditors catch it: They ask for life-cycle assessments of project equipment and fuel supply chains.
Fix: Use methodology defaults for leakage or conduct proper LCA studies if claiming lower values.❌ Pitfall 5: Method Mismatch
The mistake: Claiming Method 1 (efficiency-based) but unable to provide baseline KPT data, or using Method 3 (fuel switch) without accounting for fossil fuel emissions.
Why it happens: Method selection isn’t taken seriously during PDD development.
How auditors catch it: They verify your method choice against actual data collection and intervention logic.
Fix: Choose your method strategically during project design and ensure data collection aligns with that method's requirements.From Formula to Verification: What Happens Next
So you’ve calculated ERy = 1,313 tonnes for your project year. Now what?
Step 1: Document Everything
Create an audit trail showing:
Step 2: Submit Monitoring Report
Your annual report goes to the registry (Gold Standard, Verra, etc.) containing:
Step 3: Verification
A third-party VVB (Validation/Verification Body) audits your claim:
Step 4: Issuance
Once verified, the registry issues VERs (Verified Emission Reductions) into your project account. These can now be sold to corporate buyers, governments, or individuals.
The Big Picture: Why This Formula Matters Beyond Carbon
Yes, we’ve spent 10 weeks building up to an equation that calculates tonnes of CO₂. But look deeper at what this framework enables:
🌍 Climate Impact
💰 Financial Flows
📊 Data Rigor
⚖️ Accountability
🔗 SDG Linkages
The same households generating carbon credits are also experiencing:
The formula doesn’t just calculate carbon—it’s the backbone of accountable development finance.
Your Mental Model: The ERy Formula as a Bridge
Think of the ERy formula as a bridge connecting three worlds:
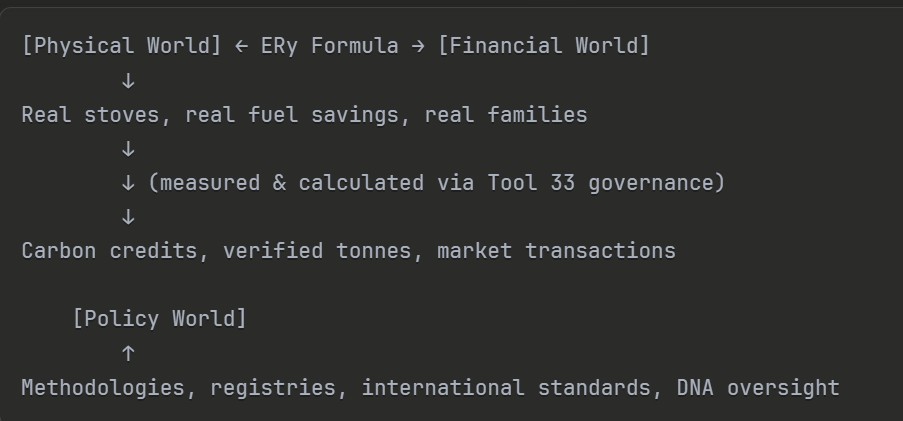
Without this bridge:
The formula is how we make climate impact legible, traceable, tradeable, and scalable.
The Tool 33 Revolution: A Turning Point
Let me be direct: Tool 33 adoption by GS4GG is one of the most important integrity improvements in voluntary carbon market history.
Here’s why:
Problem it solved: For decades, fNRB was the “wild west” parameter—the one variable where project developers had enormous discretion and auditors struggled to apply consistent standards.
How it solved it: By creating a non-negotiable hierarchy that removes subjectivity and enforces conservativeness through governance, not just good intentions.
What it signals: The VCM is transitioning from a trust-based system ("we promise we're conservative") to an evidence-based system ("here's the official data source we're required to use").For Practitioners, This Means:
For the Planet, This Means:
Tool 33 is proof that market evolution toward quality can happen through smart governance design.
The ERy formula is more than just math; it’s a bridge between the physical reality of a kitchen in rural Kenya and the ESG goals of a corporation in London. It creates accountability and financial flow to the places that need it most.
At Doowe, we’ve built the tools to make this complex journey seamless for you.
Whether you are looking for a partnership or expert ESG consultancy, we are here to ensure your commitment to the environment is concrete and verifiable.
Contact us today:
🌐 Web: www.doowe.uk
Source : https://www.linkedin.com/pulse/